“Nothing short of a revolution:”
How the Internet of Things is shaping accessible tech

For hundreds of years, the luminous white marble domes and minarets of the Taj Mahal made it one of the world’s most recognizable landmarks. In the 1980s, though, the icon began to lose its luster.
The Taj Mahal is a mausoleum, erected in the 17th century by the emperor Shah Jahan in honor of his departed wife, Mumtaz Mahal. It is located in Agra, a city of 1.6 million people in the Indian state of Uttar Pradesh. The air quality in Agra, like many large cities around the world, is generally poor and causes the Taj Mahal’s white marble façade to look more like an overripe banana.
When Duke professor of civil and environmental engineering Mike Bergin first saw the yellowed monument, he wanted to know where the pollution was originating. He obtained permission to place chips of marble around the monument and then came back months later to collect them. After characterizing the film that had settled on the chips, he discovered that much of the discoloration was caused by local residents burning their trash.
"Air Quality, Quick and Dirty"
More importantly, the team linked that air pollution to hundreds of premature deaths in the area. Bergin’s lab at Duke began focusing on developing new approaches for monitoring air quality to collect and distribute data about local and regional air pollution to those who could mitigate its effects. One of the biggest challenges the group faced, of course, was money.
The U.S. uses very precise, very expensive instrumentation to monitor air quality. From coast to coast, there are around one thousand sensors, each carrying a $25,000 price tag, that track how much particulate matter of 2.5 microns or smaller (PM2.5) is in the air at any given time. That particle size is critical because of its ability to be inhaled and impair lung function. If the Raleigh-Durham-Chapel Hill region was a city, three sensors would be sufficient to keep tabs on the air, mainly because the air is homogenous, with no big industrial sources of PM2.5.
Air pollution hot spots need much closer monitoring, though. India and China, with their rapidly expanding middle classes, can afford to keep tabs on their biggest cities—Delhi has 50 highly sensitive air quality sensors and Beijing has 70.
But the world’s poorest countries can’t afford this kind of expensive scientific equipment, no matter how desperately it’s needed. “Smaller countries have equally horrendous air quality, but don’t have the necessary resources to be able to monitor,” said Prakash Bhave, a research scientist in Bergin’s group. Bhave is managing an air pollution measurement project that spans 300 locations across seven countries in South Asia— and achieving it with a relatively tiny budget, through the deployment of low-cost sensor networks.

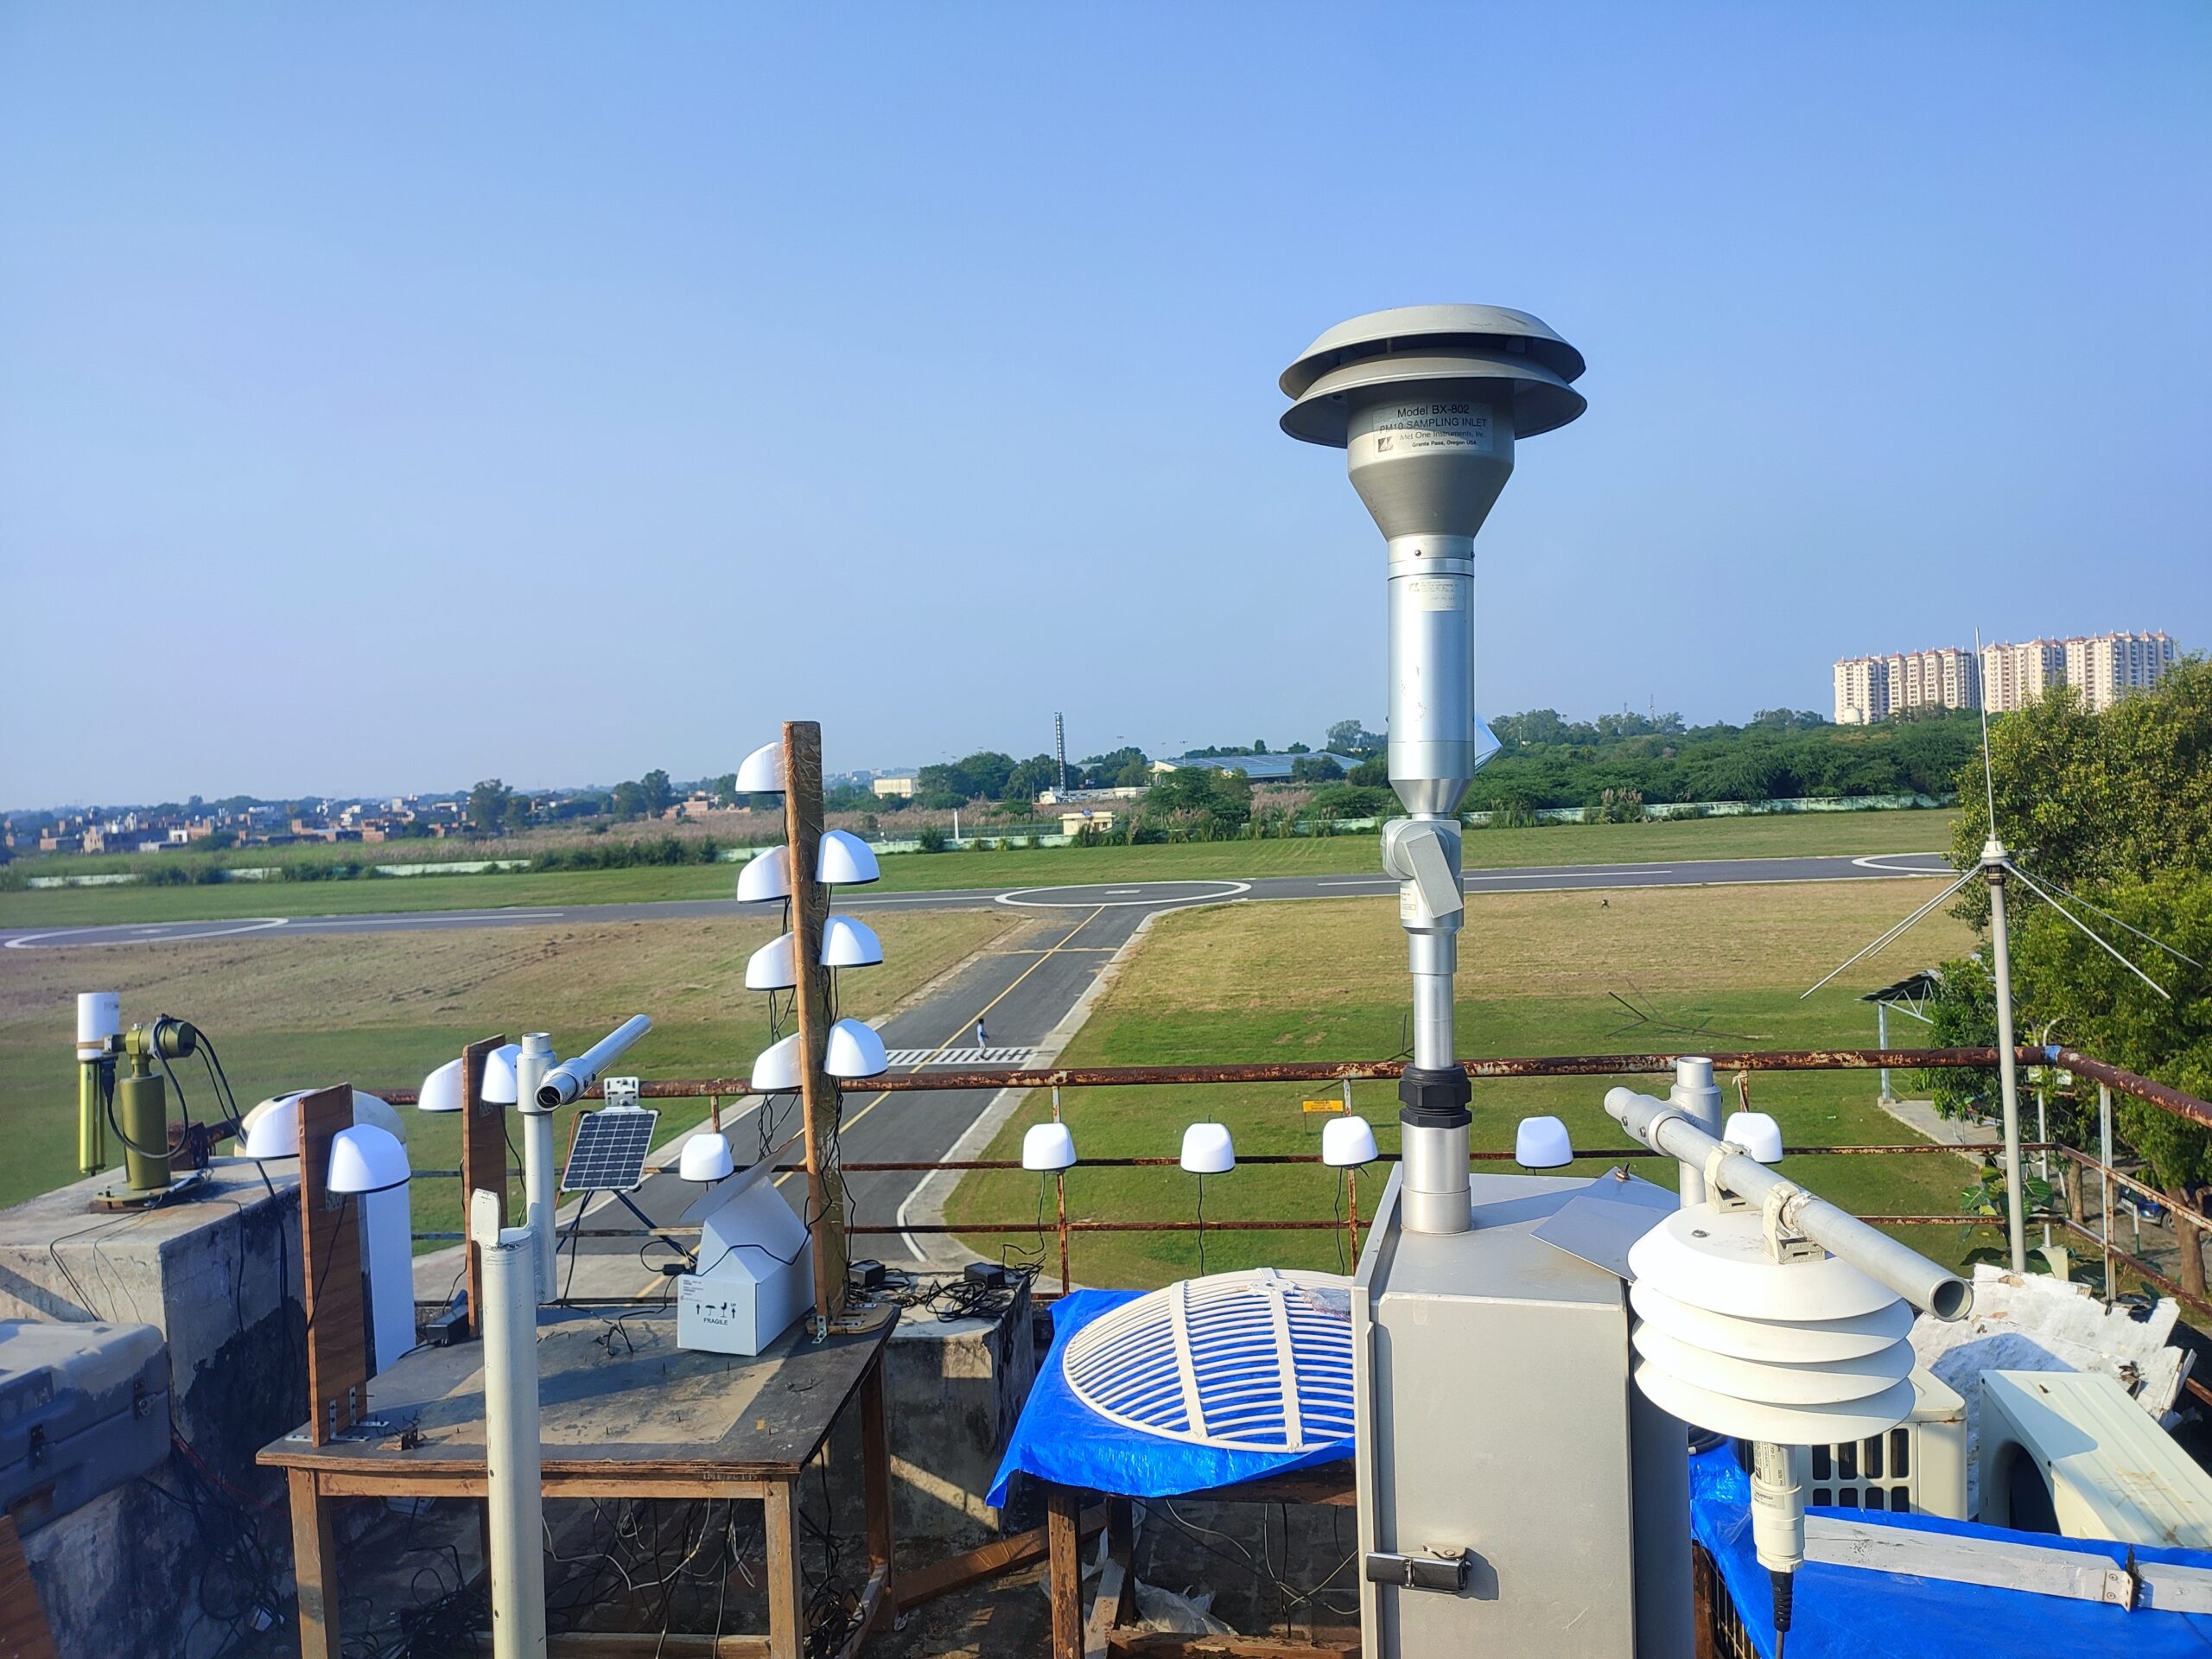
An array of sensor awaits intercomparison and calibration at the Indian Institute of Technology (IIT) Kanpur.
![IMG-20210908-WA0000[32] Intercomparison, Bhutan](https://magazine.pratt.duke.edu/wp-content/uploads/sites/7/2022/10/IMG-20210908-WA000032.png)
Intercomparison underway in Thimphu, Bhutan.
When the project launched, the Duke group was developing its own PM2.5 sensors, software and visualization tools. But then Bergin convinced TSI, a precision instrumentation company, to contribute its own resources and expertise toward developing and deploying low-cost sensors across India, to demonstrate proof of concept. A state department grant allowed Duke—the earliest adopter of TSI’s low-cost sensor—to buy several hundred more of the devices. With the same amount of money, the group would have been able to purchase only a handful of the more expensive reference monitors—not to mention the costly endeavor of maintaining them.
Of course, there are tradeoffs for the small price tag.
“The difference in functionality is mainly in accuracy,” said Bhave. “Low-cost sensors have to be calibrated against a reference measurement device. The more expensive ones must be calibrated as well, but less frequently—their accuracy is ensured over a longer period of time. With low-cost sensors, the margin of error is upwards of 15%, so some correction must be made.”
Air quality sensors of all makes and models are easily flummoxed by moisture as well, which is a problem across the sites in question. In some locations, humidity never drops below 70%, even in the heat of the day, and the devices can mistake ambient moisture for PM2.5 content. Expensive sensors get around this issue by including a drying component in their design, but Bhave gets around it with math. “We check the results over and over—against each other and against a reference device,” he said.
Because the project aims to build local capacity in data analytics, which will ultimately help local government bodies to make better-informed policy, deciding how to distribute the sensors and aggregate their data was paramount. The group decided on a strategy that encompassed suburban areas fringing big, polluted cities, to give local officials an idea of how much air pollution is originating in urban areas and how much is wafting in from other regions.
A huge perk of working with an industry partner has been tapping into TSI’s visualization services. The company collects and displays the data in real time, labeling areas with high levels of PM2.5 in red to indicate danger, while areas with clean air are coded with green labels. It’s an easy way to present PM2.5 levels and the corresponding human health risks so that people with non-technical background can make sense of all the air quality data the sensors gather.

TSI’s user interface displays air quality data gathered from a sensor network (above), and lets users compare data among urban and rural locations (below).

This information is critical to areas that are striving to cut their emissions. Bhave pointed to cities that have been named pollution “non-attainment” cities by the Indian government, as an example. “Non-attainment cities have been charged with reducing their air pollution by 20%. If I was the mayor of one of these cities, I would need to know how much emissions I have to cut,” said Bhave. “Logically, you’d think 20%. But if my city is in the middle of a huge plain where air pollution is constantly blowing in, I might actually need to strive for a 40% cut in my own city to meet the attainment goals.”
It’s also relevant for nations bordering the Indo-Gangetic Plain, which stretches from Pakistan to Bangladesh and is the most populated and most polluted region of the world. The heel of Nepal, for example, extends into the region, and its government is interested in knowing how much of its air pollution it’s even capable of controlling.
There are endless ways to parse the huge amounts of data that the sensors gather. For example, the group is developing new machine learning approaches to detect hot spots at the neighborhood level and alert local citizens and stakeholders, who can then halt the trash burns and prevent residents from breathing in the extra PM2.5.
“We don’t just want to characterize, we want to reduce exposure,” Bhave stressed.
“The Internet of Things is nothing short of a revolution,” said Duke professor of civil and environmental engineering Henri Gavin, who is also leading a project in Nepal that focuses on developing earthquake early warning devices.
“All the components of a system, from peripheral sensors to microcontrollers to the web interface, are extremely inexpensive. The IoT opens up accessibility and scalability for a whole spectrum of technologies and is more user-friendly and more powerful than anything else in the space of measurement, analysis and dissemination.”

The devices designed in Gavin’s lab incorporates three $40 components called geophones that measure vibrations in the earth. The signal is converted from a voltage to a number through an analogue-to-digital converter before being transmitted to the device’s microcontroller to display.
There are some custom electronics connecting the geophone and the analogue-to-digital converter, which students developed over the past summer through Bass Connections, a Duke initiative that funds interdisciplinary research teams composed of both faculty and students. The Nepal group hasn’t been able to travel over the past couple years due to COVID, but they’ve been learning a lot about sensor development and hardware requirements, and Gavin has high hopes for what the 2022-23 Nepal cohort will be able to accomplish. “With all the components of the IoT, the breadth of options are so vast that we’re limited only by our imaginations,” he said.
Duke and its university partner, Tribhuvan University’s Institute of Engineering (IOE) in Lalitpur City, Nepal, have been working for several years to optimize the sensor’s operating system to support an IoT server, making it programmable via the internet, while at the same time securing it from the threat of cyber hazards. They also extended the sensor’s original algorithm to make cooperation amongst multiple sensors possible. From the first three seconds of a quake’s pressure wave, or P-wave—the waves that precede the more damaging shear waves—they can invert to determine its origin and magnitude and triangulate to determine the distance from the other sensors in the network.

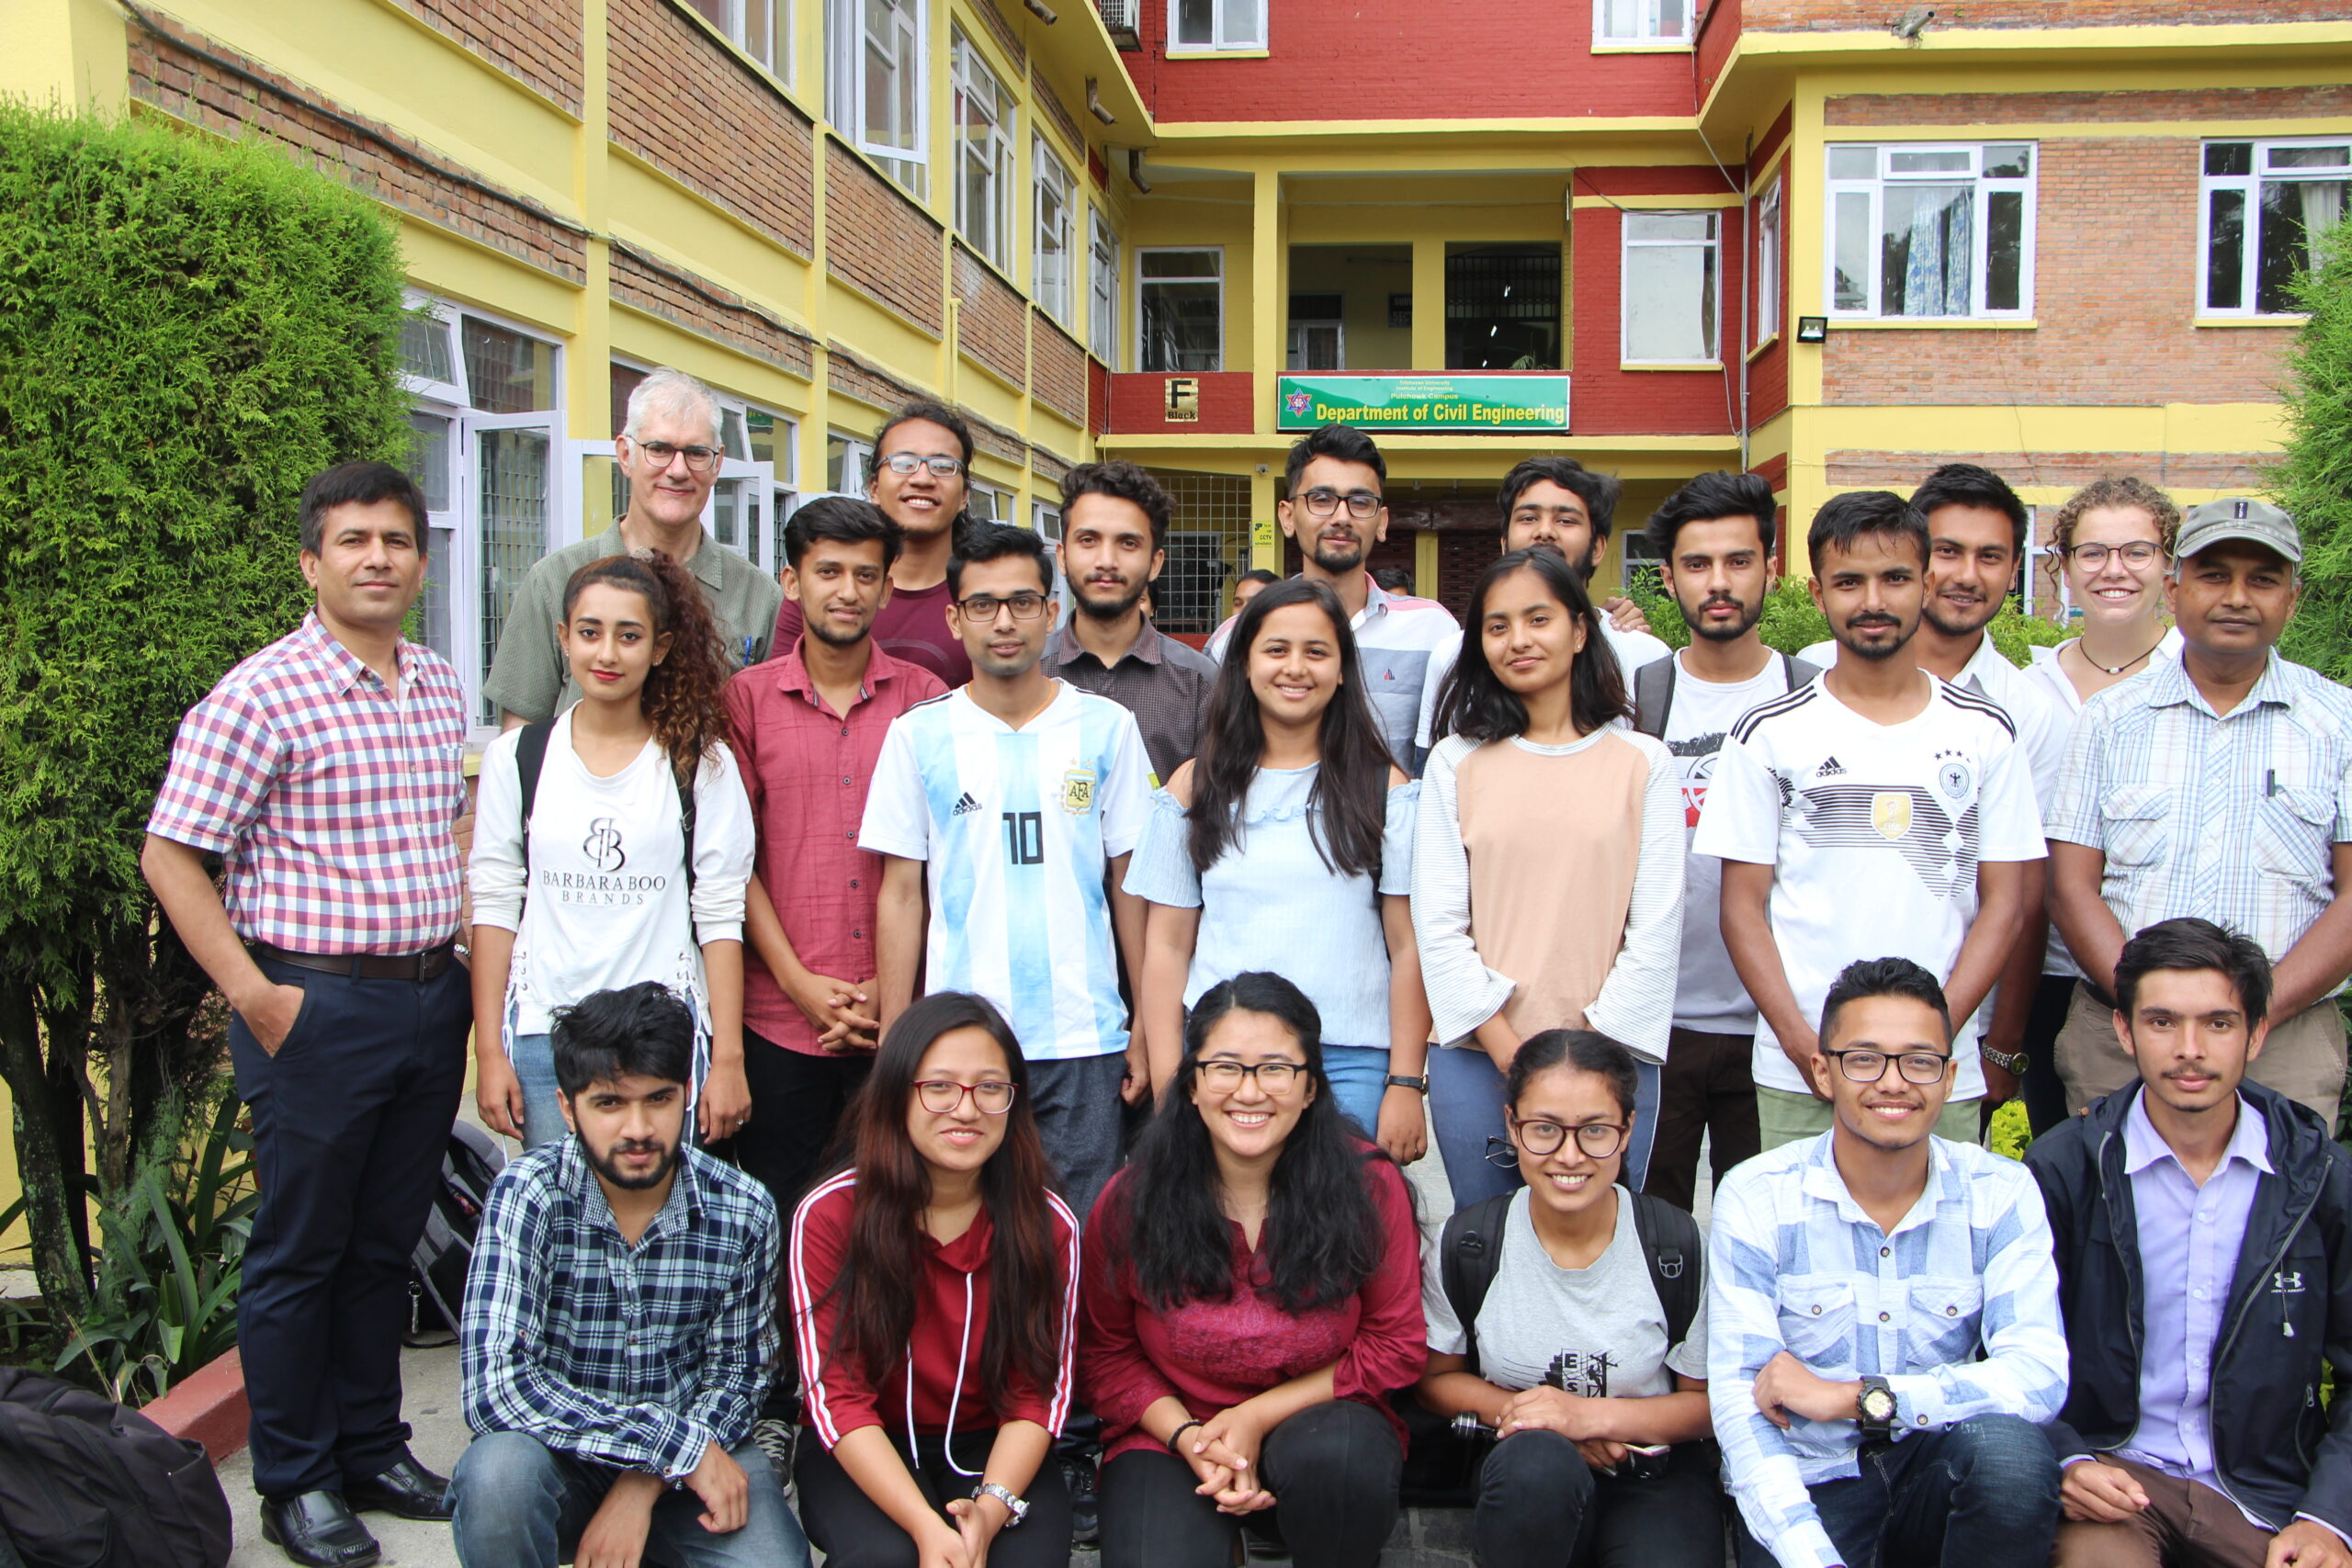
Photo: As an undergraduate Duke CEE student, Rachael Lau (back row, far right) helped establish a research cohort on earthquake risk and resiliency between Duke and the Institute of Engineering, Pulchowk Campus in Kathmandu. Now, as a Duke CEE PhD student, Lau will spend the next year in Nepal as a Fulbright Scholar, studying satellite data to help predict landslides.
With the devices Gavin’s group is cooking up, quantity is important, because the amount of early warning is directly related to the distance between sensors. And even a handful of seconds, in an earthquake, might give someone enough time to get to safety and prevent the kind of losses the country saw in the devastating 2015 earthquakes, when more than 9000 people lost their lives.
“If sensors were spaced every 50 kilometers over the nation, we could expect, at a minimum, ten seconds of early warning. That’s enough time to duck, cover and hold on,” said Gavin.


